
|
Protein Crystallography Course
|
Since diffraction arises from the interaction of matter with waves, we have to understand something about the behaviour of waves. We need to understand first how to describe waves, both the terminology and (at some level) the mathematics. Diffraction results from the addition of waves scattered by different objects, so we also have to understand how waves add up and how this reflects the relative positions of the objects scattering them.
It's worth noting here that we're treating X-rays as classical waves without worrying about their particle properties. Fortunately, we don't have to bring quantum mechanics into the picture to get a good understanding of diffraction.
Electromagnetic waves, such as X-rays, vary over time and space. Although there is also a magnetic component that varies perpendicular to the electric field component, it is the variation in the electric field that interests us. That is because, as discussed in the overview, X-rays interact with matter through their interaction with charged particles, particularly electrons.
Whether you look at an electromagnetic wave as a function of position (along the direction of propagation of the wave) at some particular time, or as a function of time, at some particular position, the electric field will have a cosine shape.
Let's consider time first. For simplicity, let us look at the wave at a position where it is at a peak at time zero.
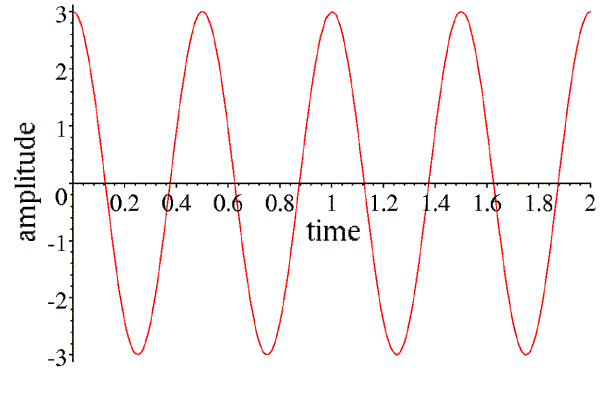
This wave can be described by its amplitude (the height of the peaks, in this case 3), and its frequency (how many times it repeats per unit time, in this case 2). Instead of frequency, we can speak of the period of the wave (how long it takes to repeat, in this case half of a time unit), which is the inverse of the frequency. If we call the amplitude A, the time t and the frequency ν, then the equation describing this wave is given by:
A cos(2πνt)
Note that whenever the time is a multiple of the period (or when the product of the time and the frequency is an integer), the argument of the cosine is a multiple of 2π, and the wave repeats.
However, we can also consider a snapshot of this wave at a particular time, as a function of position along its direction of propagation. If we pick time zero, then the wave will be at a peak at the starting position we chose for the picture above.
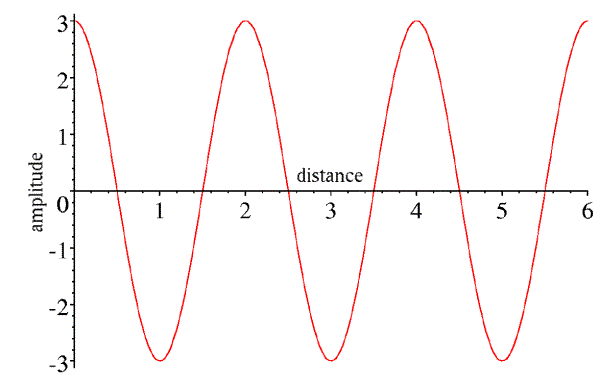
Again, this wave has an amplitude of 3. It is also characterised by its wavelength (the distance between peaks, in this case 2). If we call the wavelength λ and the distance along the direction of propagation x, then the expression describing this wave is:
A cos(2πx/λ)
Note that whenever the distance is a multiple of the wavelength, the argument of the cosine is a multiple of 2π, and the wave repeats. Also (and this will become important in just a moment), we could easily replace this expression by A cos(-2πx/λ), because the cosine is the same for positive and negative arguments.
Now, x was chosen to be along the direction the wave propagates, so if we wait a little while, the wave will move forward. If we wait for a quarter of the period, we will get the following picture:
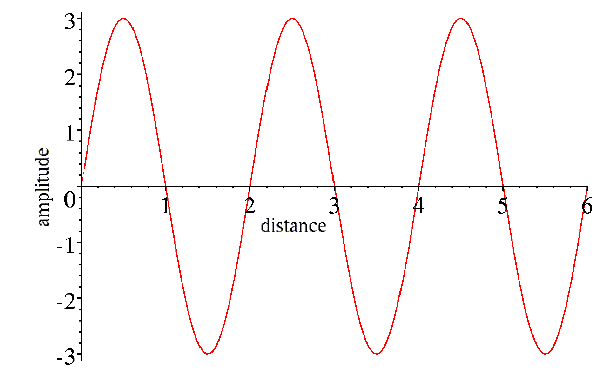
Note that the amplitude has dropped off to zero at position zero, as it did after one-quarter of the period in the picture of the wave as a function of time. Now, what we would like to do is to combine the effects of time and position into a single expression for the wave. You can see that we can cancel out the effect of time by moving forward a quarter of a wavelength to get to the peak that started at the origin. So position and time act in opposite senses on the wave, and their effects can be combined by subtracting the effect of position from the effect of time:
A cos[2π(νt-x/λ)]
We can think of the effect of time as having shifted the phase of the wave, so that its peak is no longer at the origin.
It's interesting to think about the size of the units for X-rays. In a typical diffraction experiment, the X-rays have a wavelength of about 1Å, which is one ten-thousand-millionth of a meter. The waves are moving at the speed of light (300 million meters per second), so it takes about 3*10-19 second for the wave to move from peak to peak. Obviously it doesn't make much sense to think about measuring the phase of a photon as it strikes a detector! What matters to us in the diffraction pattern is the relative phase of different diffracted rays. Since all we're interested in is relative phase, then we're free to fix the absolute phase in whatever way we wish. By convention, we fix it so that if a wave is scattered from the origin of the crystal coordinate system, its phase is zero, i.e. it has a peak at the origin. Considered at other points in the crystal, the wave is phase-shifted by the difference in position.
We have probably all learned the physical meaning of the cosine and sine functions when we were taught basic trigonometry. The cosine of an angle is simply the x component of a unit vector after it is rotated by that angle around a unit circle. If the vector is rotated at some constant speed, then its x-value will trace out a cosine wave as a function of time.
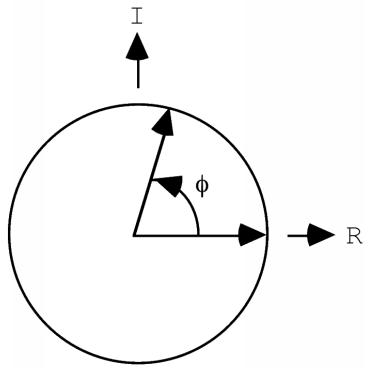
If the vector has a length of one, its x-value will trace out a cosine function, but in general it will trace out a wave with an amplitude given by the length of the vector. If we consider a point other than the origin, the wave will start out with a phase other than zero, so it will have a phase shift. If we wanted to worry about waves with different wavelengths or periods, we would have to consider the vectors as rotating at different speeds. But for X-ray crystallography, we're only concerned about the behaviour of a photon, which has a single wavelength. So that allows us to summarise the other properties of the wave as a vector in the plane: the length of the vector represents the amplitude of the wave, and the angle it makes with the horizontal axis represents its phase.
(Don't worry yet about the "I" and "R" labelling the axes. In the advanced series, we will see that there are great mathematical advantages to considering the vector to be a vector in the complex plane, with real and imaginary components. But that isn't important for a qualitative understanding.)
If we want to add the expressions for two waves, we can get into some rather nasty trigonometry. Can you remember how to work with the following expression?
A cos(α+φ1) + B cos(α+φ2)
This is where the vector representation of waves becomes very useful. We can represent the two individual waves as two vectors, one with a length A rotated by an angle φ1 from the horizontal axis, and another with a length B rotated by an angle φ2. We get the wave we want by adding the x component of each of these vectors as they continue to rotate. If we shift the head of the B vector to the tail of the A vector, it doesn't change its x component, even as it rotates, so the x component of the sum of the two vectors defines the sum of the two waves. So we have turned a difficult trigonometric problem into a fairly trivial geometric problem.
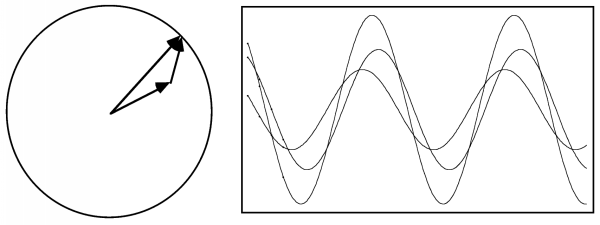
The result is a cosine wave with the same wavelength but a different amplitude and phase that are given simply by the sum of two vectors.
You can think of X-rays interacting with matter as being scattered (or re-emitted) in all directions from the electrons they encounter. X-rays scattered from different electrons will travel different distances, so they will differ in their relative phases and there will be interference as they add up. They can add up in phase, so that the resulting amplitude is the sum of the individual amplitudes, or out of phase, so that the resulting amplitude is the difference of the individual amplitudes, or anything in between.
Much of diffraction can be understood qualitatively if we understand when waves scatter in phase. In particular, we can understand why crystals amplify the scattering signal to one we can measure, and why the diffraction pattern is restricted to discrete spots.
Diffraction spots are often called reflections, because you can think of the crystal as being composed of thousands of mirrors that reflect the X-rays. These "mirrors" are called Bragg planes.
When light is reflected from a mirror, the angle of incidence (the angle at which it strikes the plane of the mirror) is equal to the angle of reflection. The same is true of Bragg planes, and the reason is that when the angle of incidence is equal to the angle of reflection, light rays hitting the plane (mirror) in phase exit in phase, regardless of where they hit the mirror. The following figure shows why.
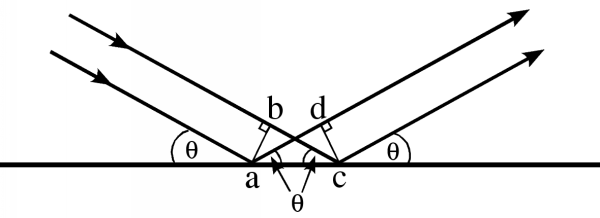
In this figure, the two incoming light rays are in phase at the line ab. If the lines ad and bc differ in length, they will be out of phase at the line cd. But if those two lines are the same length, they will be in phase. We can see that the lines will be the same length if and only if the angle of incidence is equal to the angle of reflection, by considering two triangles in the figure, abc and cda. The angles abc and cda are both right angles, and the shared side ac must be the same. If one other angle is the same, then the two triangles must be congruent. Now, the angle acb is the angle of incidence, and the angle cad is the angle of reflection. When these angles are the same, then the triangles are indeed congruent and the sides ad and bc must be the same. So the rays reflected off of two points on the plane have identical pathlengths, and remain in phase with one another.
Notice, by the way, that the incoming and outgoing rays differ in direction by a total angle of 2θ. When you are looking at a diffraction pattern, you always have to remember to divide the angle from the direct beam by two to get the angle of incidence, θ!
If rays reflected from a plane have identical pathlengths, then rays reflected from different planes must have different pathlengths. We can easily work out how far apart the planes must be for the difference in pathlength to be equal to the wavelength of the incoming radiation, so that the scattered rays from the two planes would again be in phase. It turns out that the difference in pathlength depends on the angle of incidence (and reflection). The following figure shows how to work out the relationship, which is called Bragg's law.
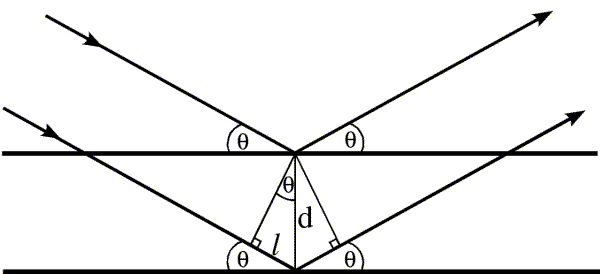
The difference in pathlength between the rays reflected from the two planes is twice the distance l. Simple geometry tells us that the upper angle in the little triangle must be θ, because the sum of the angles inside a triangle is 180 degrees, and the other two angles are 90 degrees and 90-θ. Then simple trigonometry tells us that the distance l is equal to d sinθ. For the two rays to be diffracted in phase, twice l must be equal to the wavelength, so we have the relationship:
λ = 2 d sinθ
In fact, the two waves will be in phase if the pathlengths differ by any multiple of the wavelength, so Bragg's law is usually expressed as nλ = 2 d sinθ. However, from the point of view of the information in the diffraction pattern, it makes more sense to choose d so that n is equal to one.
It should also be obvious that, while objects on the planes diffract in phase, objects between the planes will diffract out of phase. The phase shift will be proportional to how far the object is from one plane, as a fraction of the distance to the next plane. So we can see that a single diffraction event tells us about the positions of objects relative to these sets of planes.
In Bragg's law, as the angle increases, d must become smaller for the pathlength to remain equal to one wavelength. We can show this by various common rearrangements of the equation:
sinθ/λ = 1/(2 d)
d = λ/(2 sinθ)
This is one way of understanding the concept of reciprocal space: the bigger the angle of diffraction, the smaller the spacing to which the diffraction pattern is sensitive.
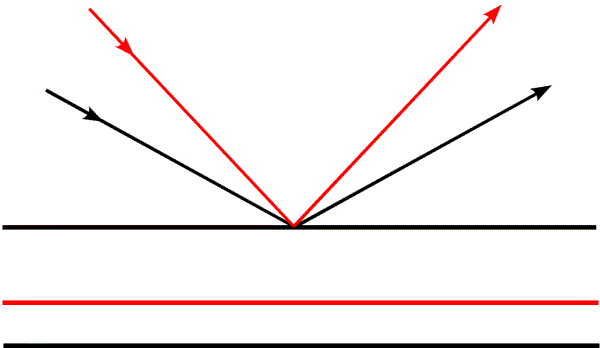
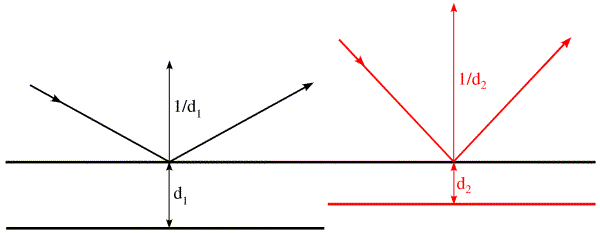
In this figure, we see how the spacing from the first to the second plane changes as the angle of incidence changes. The second black plane belongs to the black rays, and the red plane to the red rays. It is useful to think about two limits to the scattering angle: θ=0 degrees and θ=90 degrees. At 0 degrees, the rays are not changed in direction and pathlengths are the same regardless of the positions of objects. The corresponding d-spacing is infinite, which means there is no distance between planes that gives a change in phase, there is no diffraction, and there is no spatial information. When θ is 90 degrees, the waves are reflected straight back at the source. The difference in pathlength is obviously twice the distance between the planes (the waves have to get there and back again). So we are limited to information about spacings equal to half of the wavelength of the radiation we are using. To get higher resolution information, it is necessary to choose a shorter wavelength (which is why we are talking about X-rays instead of visible light, after all).
In the figure above, we have kept the object fixed and changed the angle of the incoming radiation. To observe the same diffraction events, we could also keep the incoming radiation fixed and rotate the object (which is what we do experimentally in an X-ray diffraction experiment.) It is also interesting to consider what happens if you keep both the object and the incoming radiation fixed. Then different diffracted rays correspond to sets of planes that are not parallel to each other, as shown in the following figure:
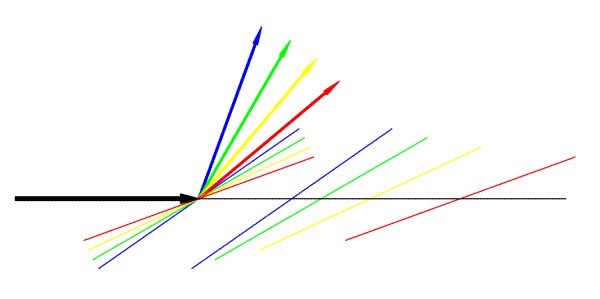
In this figure, the large black arrow represents the incoming radiation. Coloured arrows represent different diffracted rays, and a pair of Bragg planes is shown in the same colour.
Let's think about what information we get from a single diffraction event. As mentioned, objects that lie on the Bragg planes will scatter in phase. So if all the objects sat on planes with a particular d-spacing, we would see very strong diffraction for the corresponding direction of scattering. However, if half of the objects sit on the planes, and the other half sit halfway in between, the two sets will scatter out of phase and there will be no diffraction. In general, then, a single point in the diffraction pattern tells us to what extent the objects are concentrated on the corresponding planes. It tells us about the average position of objects in the direction perpendicular to the planes, but nothing about their position in the directions parallel to the planes. This is illustrated in the figure below:
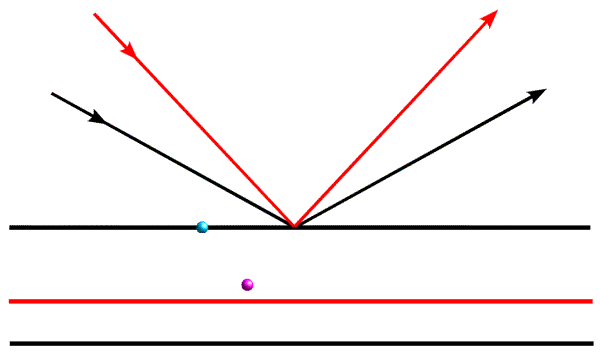
When we are considering the diffraction event represented by the black arrows, the blue object and the magenta object will scatter out of phase, so their contributions to the total diffracted wave will cancel out. However, when we look at them with the diffraction event represented by the red arrows, they will add up more nearly in phase.
As we have mentioned before, a crystal amplifies the diffraction pattern in certain directions, where the various unit cells diffract in phase, and eliminates it in other directions. In order for the unit cells to diffract in phase, the Bragg planes must pass through the same points in all the unit cells in the crystal. The easiest case to imagine is when the planes are separated by one unit cell edge, or an integral fraction of a unit cell edge. In the following picture, you can see that sets of planes separated by one unit cell edge or one-third unit cell edge will pass through equivalent atoms in the different unit cells. On the other hand, if the planes divide the unit cell edge by a non-integral number, the different unit cells will all diffract out of phase and the waves will cancel out.
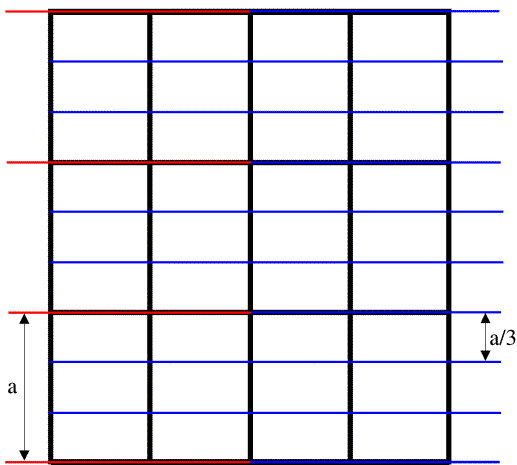
The black lines in the figure outline the unit cells, the red lines indicate planes separated by one unit cell edge along the a cell axis, and the blue lines indicate planes separated by one-third unit cell edge along a. (The unit cell is outlined by three cell edges, a, b, and c along the x, y and z directions respectively.)
Note on indexing diffraction patterns: the red planes are called the (1 0 0) planes because they divide the a cell edge once, and the blue planes are called the (3 0 0) planes because they divide the a cell edge three times. This again relates to the idea of reciprocal space: the planes (and corresponding diffraction spots) with larger indices correspond to closer spacings; the (3 0 0) planes are one-third as far apart as the (1 0 0) planes. The three indices are called h, k and l, so that in the figure above we are looking at two sets of (h 0 0) planes.
In general, to see diffraction from a crystal, the Bragg planes have to cut all the cell edges an integral number of times. (In, say, the (3 0 0) planes, the b and c cell edges are cut zero times.) It's easier to illustrate this in only two dimensions by looking at (h k 0) planes. Three sets of these are shown in the figure below.
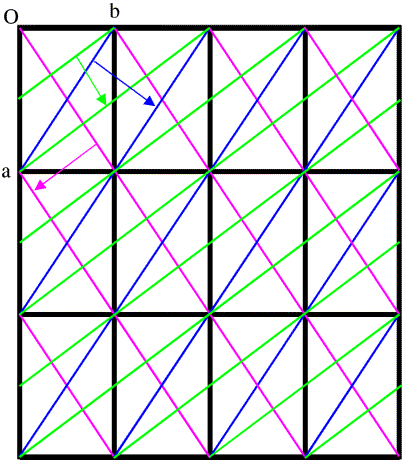
This is a bit more complicated! First look at the blue planes. As we follow the blue arrow from one plane to the next, the next plane is one unit cell edge further along in both the a and b directions, so these are the (1 1 0) planes. The magenta planes are similar, but as we follow the magenta arrow from one plane to the next, the next plane is one unit cell edge further in the a direction, but one cell edge back in the b direction, so these are the (1 -1 0) planes. With the green planes, as we follow the green arrow from one plane to the next we move half a unit cell edge along a and a full cell edge along b, so these are the (2 1 0) planes. (Another way to look at this is that we have to cross two planes to move one cell edge along a but only one plane to move one cell edge along b.)
We have mentioned different ways in which the concept of reciprocal space arises: higher angle scattering corresponds to closer spacings; increasing the indices of the planes corresponds to finer sampling along the cell edges. But there is also a physical picture that might help you to understand reciprocal space (particularly if you are a bit mathematically inclined).
In this figure, the Bragg planes and the incoming and reflected rays are shown as before for two diffraction angles, but now we have added a vector perpendicular to the Bragg plane for each. Such a vector (a plane normal) is a common way to specify a plane. Ignore the length of this vector for a moment, and remember that the phase of a wave diffracting from an object depends on the fraction of the distance of the object from one Bragg plane to the next. If we think of the position of the object as a vector, then the distance of that object from one of the Bragg planes can be obtained by projecting that vector on the plane normal. The phase shift can then be obtained by dividing the projected distance by the Bragg spacing between the planes. Mathematically, we can carry out the projection and the division by giving the plane normal a length equal to the reciprocal of the Bragg spacing, and then computing the dot product between the position vector and the plane normal. Because the plane normal is a vector with a length reciprocal to the spacing in the object, we call it a vector in reciprocal space.
Ewald came up with a geometrical construction to help visualise which Bragg planes are in the correct orientation to diffract. First look at the figure on the left below. We represent the incoming and diffracted rays as vectors, and it turns out to be convenient to give them a length of 1/λ. The incoming ray (labelled 1) and the diffracted ray (labelled 2) are both at an angle θ from a set of Bragg planes in the crystal. Let's consider the difference (shown in red) between the direct beam passing undeflected through the crystal (labelled 3) and the diffracted ray. By simple geometry, this red vector is perpendicular to the Bragg planes, so it is in the direction of the reciprocal space vector shown above. In the small internal triangles, we can see that the sides corresponding to the two halves of the red vector each have a length of sinθ/λ, which (by Bragg's law) is equal to 1/2d. So the red vector is, in fact, the reciprocal space vector with a length of 1/d. (That is why we chose to give the X-ray vectors a length of 1/λ in the first place.) Such a construction could be made for any set of planes in the diffracting condition, and the corresponding reciprocal space vector would be seen to go from the position of the undeflected direct beam to the tip of the vector representing the diffracted ray. Because all of these reciprocal space vectors start from the same point, the base of the red vector in the figure must define the origin of reciprocal space.
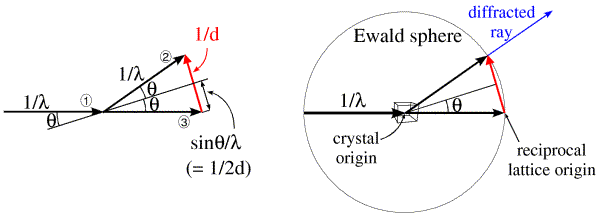
The angle 2θ can be anything from 0 to 180 degrees (or θ can be anything from 0 to 90 degrees). The diffracted ray can go in any direction in three dimensions, so the vector representing it can have its tip anywhere at the surface of a sphere with a radius of 1/λ. Such a sphere, called the Ewald sphere, is shown in the figure on the right. The diffracted ray has its base at the center of the sphere, so we think of this as the origin of the crystal. But the origin of reciprocal space has to be at the point where the direct beam exits the sphere. We can see from this construction that, if a set of planes is in the diffracting condition, the corresponding reciprocal space vector has to end on the surface of the Ewald sphere. Conversely, if the direct beam does not strike the planes with the correct angle θ, the reciprocal space vector will not be on the surface of the Ewald sphere.
In the Ewald sphere, we have two origins (which can make you uncomfortable until you realise that it is just a geometrical construction that makes the mathematics of diffraction easy to picture). The origin of the crystal is at the center of the Ewald sphere, and the incoming X-rays are diffracted from that crystal. The origin of reciprocal space is at the point where the incoming X-ray beam would exit the Ewald sphere. If we rotate the crystal, we rotate the Bragg planes and so we rotate reciprocal space in the same direction. Since diffraction from a crystal is confined to points on the reciprocal lattice (corresponding to planes that can be specified by integer indices), we can think of rotating the reciprocal lattice when we rotate the crystal. The following figure shows this schematically, illustrating planes of points in the reciprocal lattice. The planes of points in the reciprocal lattice intersect the Ewald sphere to give a circle of points in the diffracting condition. When the planes are aligned perpendicular to the X-ray beam, these circles on the Ewald sphere will project onto circles of spots surrounding the direct beam position but, as we rotate the crystal (and the reciprocal lattice) the circles on the Ewald sphere will be distorted and will project into what are called lunes of spots.
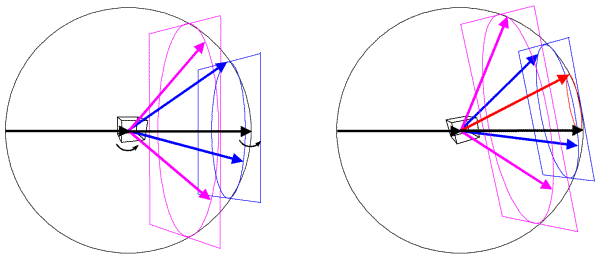
In this figure, the left side shows a crystal oriented so that planes in the reciprocal lattice are perpendicular to the X-ray beam. The planes, intersecting circles and sample diffracted beams are shown in a different colour for each plane. When the crystal is rotated, the reciprocal lattice planes rotate as well, as shown on the right. Now a level zero plane (red) has appeared from behind the beam stop.
When we put a crystal into an X-ray beam, some of the Bragg planes will be in the correct orientation to show diffraction, and we will see spots for them. If we rotate the crystal, other sets of planes will come into the correct orientation, and we will see new diffraction spots.
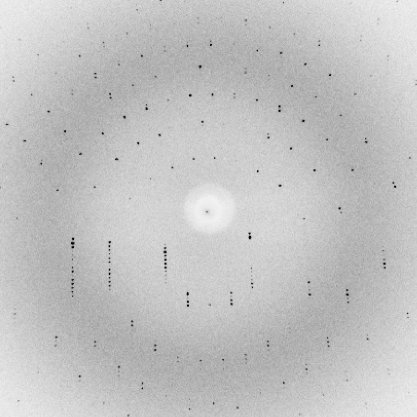
The following still image shows the result of putting a protein crystal into an X-ray beam and oscillating it back and forth by one degree around a horizontal axis. If you click on it, you will download an animated GIF file (2.8Mb) that will show how this diffraction pattern changes as we continue to rotate the crystal in one degree steps for a total of twenty degrees. Notice the lunes that move up the image, becoming a set of concentric circles for a moment.
As mentioned above, we can get a perfectly useful picture of diffraction by thinking in the classical terms of waves. But it may worry you that diffraction occurs one photon at a time. Very loosely, what happens in the quantum mechanical point of view is that the photon "feels" the environment of the crystal, and it randomly chooses a path with a probability determined by the wave picture we have been considering. The probability that the photon will be scattered in any particular direction is given by the square of the amplitude of the sum of the scattered waves, which we should now consider as the quantum mechanical wave function. This is why, when we measure the intensity of a diffraction spot (which is proportional to the number of photons in that spot), we take the square root as part of determining the amplitude for our electron density calculations.
T.L. Blundell & L.N. Johnson (1976), "Protein Crystallography", Academic Press: London.
Jan Drenth (1994), "Principles of Protein X-ray Crystallography", Springer-Verlag: New York.
D. Sherwood (1976), "Crystals, X-rays and Proteins", Longman: London.
Bernhard Rupp's Interactive Crystallography Course.
Konstantin Lukin's Bragg's Law Applet.
© 1999-2009 Randy J Read, University of Cambridge. All rights reserved.
Last updated: 7 April, 2009