
|
Protein Crystallography Course
|
Although fitting a model to electron density, refining it to agree with the diffraction data, and validating the end result might seem like very different processes, in fact they are closely intertwined. All of these processes have to cope with the poor observation:parameter ratio that generally plagues macromolecular structure determination. For instance, if you describe each atom by its position (x,y,z) and an atomic displacement parameter (aka B-factor, temperature factor or thermal motion parameter), you only have one observation for each parameter at a resolution of about 2.8Å. That means that it is terribly easy to overfit the data to get a misleading level of agreement between model and experiment. Even if your crystal diffracts to higher resolution, by the time you have enough data to refine x,y,z,B for each atom, you need a more sophisticated model of molecular motion that requires even more parameters!
The following table shows observation:parameter ratios at various resolutions, assuming about 50% solvent content.
|
Resolution |
Observations/parameter |
Observations/parameter |
|---|---|---|
|
3.5Å |
0.5 |
0.2 |
|
3.0Å |
0.8 |
0.4 |
|
2.5Å |
1.4 |
0.6 |
|
2.0Å |
2.8 |
1.2 |
|
1.5Å |
6.2 |
2.8 |
The way we get around this is to exploit what we already know about protein structure. In other words, we take into account prior information about our particular protein structure or protein structures in general.
In fitting, the poor observation:parameter ratio results in ambiguous maps. Only for the very highest resolution maps would it be possible to assign nearly all of the atoms to density, without already knowing the sequence. Sequence information is, in fact, a very powerful constraint on the atomic models we can build. Next, we are strongly constrained by the known bond lengths and angles of amino acids and their peptide bonds. And, as we will see later, we can exploit what we know about preferred conformations for these groups.
In refinement, because we do not have enough observations, we need either to reduce the number of parameters or effectively increase the number of observations. Typically, we add observations in the form of geometrical restraints, which keep bond lengths, bond angles and atomic contacts in the ranges typically seen in very high resolution structures.
As we proceed, the phase information computed from the atomic model gradually becomes more accurate, and therefore more important, than any experimental phase information we might have had. The maps become clearer, so that it is easier to resolve regions of ambiguity.
At the end, we need to decide whether we can have confidence in the model that results from fitting and refinement. There have been gross examples of severe overinterpretation, which led to (apparently) good agreement with the data but with atomic models that have subsequently been shown to be completely wrong. Validation is the process of examining the final refined model in the light of the knowledge we have about what proteins look like. Validators like to have something to look at that the refinement program hasn't been programmed to optimise, such as torsion angles or the chemical environments of certain residues.
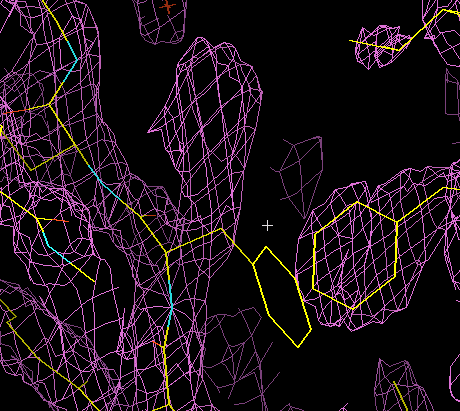
An electron density map, in all its three-dimensional glory, is a rather daunting object to comprehend. Once there is an atomic model inside the density, you only need to understand it locally, so it becomes much easier to deal with. Even the map below, a good one from near the end of refinement, is clarified a lot by an atomic model inside it.
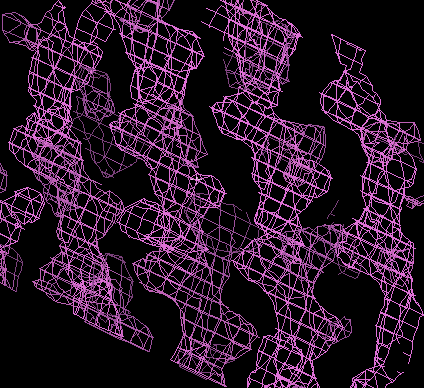
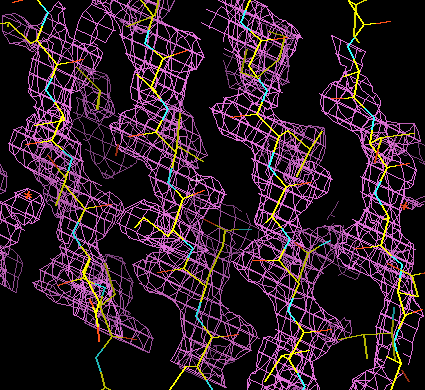
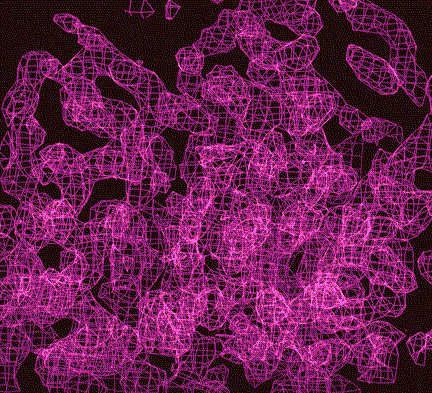
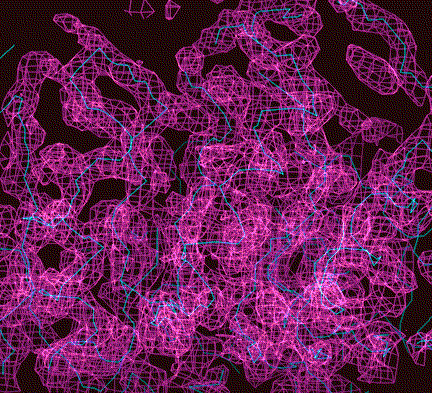
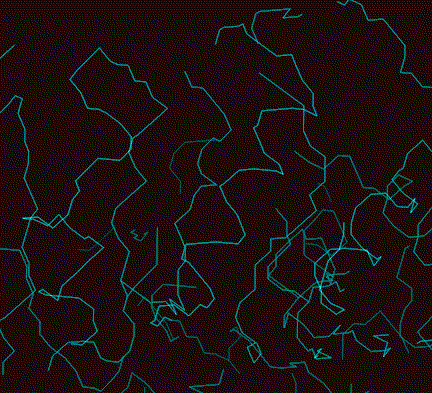
So the problem of fitting an initial model is to see the forest for the trees. To get an overview of a density map, it needs to be simplified in some way. This is generally done through skeletonisation, or by making a "bones" representation of the map. In skeletonisation, the map is reduced to a series of lines that run between the peaks of density, through regions of reasonably high density. With this representation, a lot of information can be presented quite simply. This is illustrated in the three figures below, again taken (for clarity) from a better map than one would usually see at the beginning of fitting. The top figure shows a large chunk of density, the second shows the same density with the bones representation superimposed, and the third shows the bones alone. In the third it is easy to see helices and, with a bit of imagination, strands of beta-sheet.
The "bones" representation of a map then becomes a guide to fitting. By getting an overview, you can often see that several strands will make up a beta-sheet, or that an alpha-helix runs through a particular region. If you are particularly sophisticated in your knowledge of protein structure, you might even be able to see that the pieces of secondary structure could be joined up to form a known subdomain structure. (Or if you're lucky, you can ask Alexei Murzin to look at it for you!)
Once you have an idea of some landmarks in your structure, you can start to fit the polypeptide chain by choosing plausible alpha-carbon positions from the bones. It helps a lot to know that alpha-carbon atoms are always separated by about 3.8Å, that the peptide unit between them is planar, and that side-chains branch off from them. So guided by the bones you can look for the right kind of features to get started. In O and XtalView, there is a "baton" feature in which you start from one alpha-carbon position and choose the next one at an appropriate point 3.8Å away, fix that, choose the next one, and so on.
Then once you have a trace of the main chain, you can take advantage of what we know about protein structure. It turns out that there are hardly any five residue stretches of a new protein that we haven't already seen many times before in other structures. So your alpha-carbon trace can be used to look in the database to find similar stretches of main chain. Although this approach was pioneered by Alwyn Jones in his programs Frodo and O, it is now available in other packages as well. There are two big advantages to using database fragments. First, it's a lot faster than fitting from scratch. Second, the resulting model will almost certainly be much more accurate than a manually-built model.
Once the main chain is traced, you have to work out where you are in the sequence. Some side chains, e.g. tryptophan, have characteristic shapes and are typically well-ordered. Sulfur atoms have about twice as many electrons as the other atoms in proteins, so disulfides and methionines often stand out. (In nucleic acids, phosphate groups serve as valuable signposts.) But "fuzzier" information can also be used. There are tools in programs like O that will match the sequence of your structure with descriptions of the side chains in terms of size, bulk and environment (inside or outside).
Then the side chains are fit into density, again using information from structural databases. Side chains are generally found in one of a few favoured conformations, called rotamers. Fitting programs will present you with a number of choices for each side chain and may even make a tentative choice for you, based on fit to electron density. Again, the advantage is that the best fitting rotamer is more likely to be correct than an arbitrary conformation adjusted to fit the density. If the correct rotamer is chosen, even if it is not centered in density, the refinement program will be more likely to be able to adjust the local main chain conformation correctly.
The animation below illustrates how this works in XtalView. (If the animation has stopped or gone blank, try clicking "Reload" to get it looping again.) The phenylalanine side chain starts off in an incorrect conformation. It is activated for fitting (it turns green), then three possible rotamers are examined. The correct one is chosen, it turns yellow, and the old conformation disappears.
Automated refinement, as discussed in the next section, will make the small adjustments necessary to make the model agree better with the data, which will have the effect of improving the fit to the electron density. As mentioned above, the phases computed from the model will generally become more accurate than any experimental phase information, so the maps will be getting clearer all the time. This will allow us to see, with confidence, the more ambiguous features, such as poorly-ordered side chains or water molecules. Regions of the structure that were interpreted incorrectly in earlier maps will become clearer. This happens in spite of the fact that they are contributing incorrect phase information to the map calculation, because the improvement of all the other atoms in the structure leads to a general improvement in phase accuracy.
The process of refitting differs from initial fitting only in the emphasis placed on different tools. It is no longer as important to obtain an overview of the structure. However, it is still important to draw on the knowledge gained from structural databases, by favouring conformations that have been seen before.
In the course of refitting, some of the tools discussed below for validation become important. Problem regions in the structure can be highlighted by finding unlikely bond lengths, bond angles, torsion angles or residue environments. As well, there are tools to quantify the local fit of the model to electron density.
As noted above, a big problem with macromolecular structure determination is the poor observation:parameter ratio at the resolutions to which crystals normally diffract. If we simply refine the positions and B-factors of all the atoms, the refinement will be poorly behaved, the data will be terribly overfit, and the resulting atomic model will probably be very poor.
The way we deal with this is either to add "observations" in the form of restraints, or reduce the number of parameters by constraining the model in some way. Typical restraints include bond lengths, bond angles and van der Waals contact distances. There are generally also restraints to keep planar groups planar, and to maintain the chirality of chiral centres. The restraints are entered as terms in the refinement target, and are weighted so that the deviations from ideal values match the deviations found in databases of high resolution structures.
Constraints are a bit different. When you constrain a structure, you are actually changing the parameterisation to reduce the total number of parameters. One example, discussed below, is to allow only torsion angles to be adjusted, instead of all the individual x,y,z coordinates. Another very common case occurs when there are multiple copies of a molecule in the asymmetric unit of the crystal. The model can be a single copy of the molecule, replicated by rotations and translations to create the other copies. So if, for instance, there are three copies in the asymmetric unit, the number of adjustable parameters can be reduced by a factor of three.
The purpose of automated refinement is to make the model agree better with the observed diffraction data. So we need some target to measure agreement. However, to understand how an appropriate target works it is important to understand what the diffraction data tell us about possible atomic positions.
Ignoring for the moment any experimental phase information that we might possess, each diffraction amplitude tells us something about the distribution of the atoms relative to one set of Bragg planes. If the amplitude is weak, then the atoms are scattered randomly with respect to that set of planes and their contributions to the structure factor tend to cancel out. If the amplitude is strong, then the atoms tend to be concentrated in planes parallel to the Bragg planes.
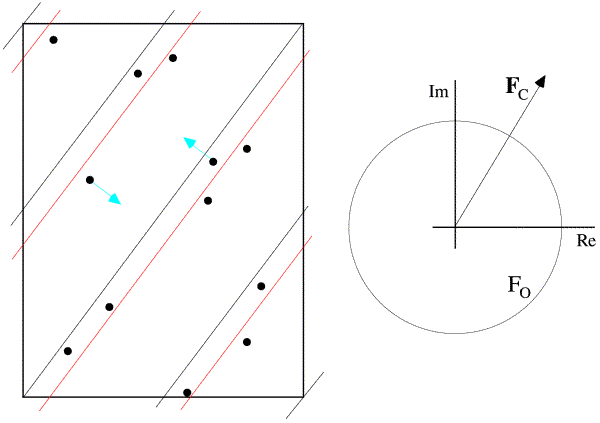
This is illustrated below. In the figure on the left, the dots represent atoms, and the black lines indicate the Bragg planes, one of which passes through the origin so that atoms on the planes would scatter with a phase of zero. The red lines indicate the planes corresponding to the phase of the structure factor computed from the model; these are the planes with the Bragg spacing around which the atoms tend to concentrate. In the figure on the right, the calculated structure factor is indicated as the vector Fc, while the observed amplitude is indicated with a circle of radius Fo. The calculated amplitude is larger than the observed amplitude, indicating that the atoms are concentrated too much about planes parallel to the Bragg planes. To make the model agree better with the data, then, the atoms can be moved away from the red planes, as indicated with blue arrows for two atoms. This is how refinement uses the observed diffraction data. Of course, every reflection gives information about a different set of planes, and they're all taken into account when the atoms are shifted.
Unfortunately, there is a bit of a complication. If we improve agreement in this way we are implicitly assuming that the phases are correct. If Fc is too large, the atoms are too concentrated about some set of planes parallel to the Bragg planes, but not necessarily the ones corresponding to the current calculated phase. So perhaps all the atoms on the lower right of the red planes should be moved further to the lower right, reducing the amplitude and simultaneously changing the phase. Or maybe all the atoms on the upper left should be moved further to the upper left. The problem is that we don't really know. Another way to look at this is that, when we decide how to move one atom, the decision depends on the position of all the other atoms, and if they're not in the right place, then we won't necessarily move that atom in the right direction.
So refinement is not just a matter of making the calculated amplitudes equal to the observed ones. It turns out that, to make the best decision about how to move an atom, we need to have an idea of the overall accuracy of the model. It is beyond the scope of this discussion to go into detail, but the approach that allows us to take overall accuracy into account is the method of maximum likelihood, which will be discussed in the advanced series.
So far we have ignored experimental phase information. You can see from the discussion above that problems arise because phase information is needed in refinement, even if it is just the model phase being used implicitly. So clearly, if there are experimental phases from MIR or MAD, they are extremely valuable, especially early in refinement when the calculated phases are inaccurate. Phase information can also be incorporated into the maximum likelihood method, but we will not go into the details here.
There are two parts to any optimisation problem: defining a target that measures what you want to improve, and finding a method to improve the target function. The refinement of a macromolecular structure is a fairly difficult optimisation problem because it is poorly determined (too many parameters for the observations) and highly non-linear (every coordinate of every atom depends on all the other atoms). The target functions are complicated functions of the parameters (positions and B-factors of atoms), with many local minima in addition to the desired global minimum.
There are two basic types of approach, which might be divided into the ones that require a random number generator (so-called stochastic methods) and the ones that don't (deterministic methods). Most of the time refinement uses a deterministic method such as steepest descents (change all of the parameters in the direction that improves the target the fastest) or more sophisticated alternatives such as conjugate gradients or full-matrix methods. But basically these all try to work out analytically how to change the model to optimise agreement.
Molecular dynamics is the most popular alternative with a random element. In this approach, the atoms are given random starting velocities, and then the program models their motions with Newton's equations of motion. The atoms are subjected to forces not only from such things as bond-stretching and angle bending, but in addition they are subjected to an "X-ray force", which pushes them in the direction that would improve agreement with the observed diffraction data. The random element and the thermal motion help to escape local minima in the target function.
A related consideration is how the problem is parameterised, e.g. do we consider the molecules to be represented by the cartesian coordinates (x,y,z) of the atoms, or do we fix bond lengths and bond angles and represent the molecules by means of the torsion angles? Especially at low resolution or at the beginning of refinement, it has been found helpful to reduce the number of parameters in this way.
Because of the poor observation:parameter ratio typical of macromolecular crystallography, it is possible to overfit the data if you are not careful. In the 1980s, there were a number of high-profile cases of structures that had gross errors, in spite of having been refined to good agreement with the observed data. No-one needs that kind of embarrassment, and it is important to be able to trust the structural database. So "validation" has become one of the catchphrases of the 1990s.
There are different aspects to validation. Some types of validation look at the fit to the diffraction data. The agreement of observed and calculated structure factors is often measured with the traditional R-factor, which is the average fractional disagreement:
R = Σ(|Fo-Fc|)/Σ(Fo)
As we have noted several times, it is possible to overfit the data, especially at moderate resolutions. This problem can be circumvented if you use most of the data (working set) to refine the atomic model, and the remaining data (test set) to verify how well you really are doing. The test set data are used to compute R-free, which is computed in the same way as the conventional R-factor but using only that subset of data. If R-free drops, then the model must really have improved because there is (almost) no pressure to overfit R-free. (The word "almost" will be explained in the advanced series.) This idea, called cross-validation in the statistical community, was introduced into crystallography by Axel Brünger and it has made a great contribution to keeping our models honest.
Other types of validation are completely model based. One of the first entries was the program Procheck, which evaluates structures on various criteria: are the torsion angles (main chain and side chain) typical of those seen in high resolution protein structures? are the bond lengths, bond angles and van der Waals contacts consistent with the databases? One example of Procheck output is a Ramachandran plot (plot of main-chain torsion angles).
A further type of information that can be used is residue environment preference. Some side chains (e.g. leucine, phenylalanine) are hydrophobic and tend to be buried in protein structures, surrounded by other hydrophobic side chains. Others (serine, asparagine) are hydrophilic and tend to be exposed on the surface or surrounded by other polar groups. If the sequence has become out of register, through an error in tracing the main chain, it can be detected by a series of amino acids being found in unfavourable environments. Such errors can be found by various threading programs, including the Profile program from Eisenberg's group.
Advanced lectures on maximum likelihood
"O"
home page
XtalView
home page (UK mirror)
Procheck
home page
© 1999-2009 Randy J Read, University of Cambridge. All rights reserved.
Last updated: 6 April, 2009