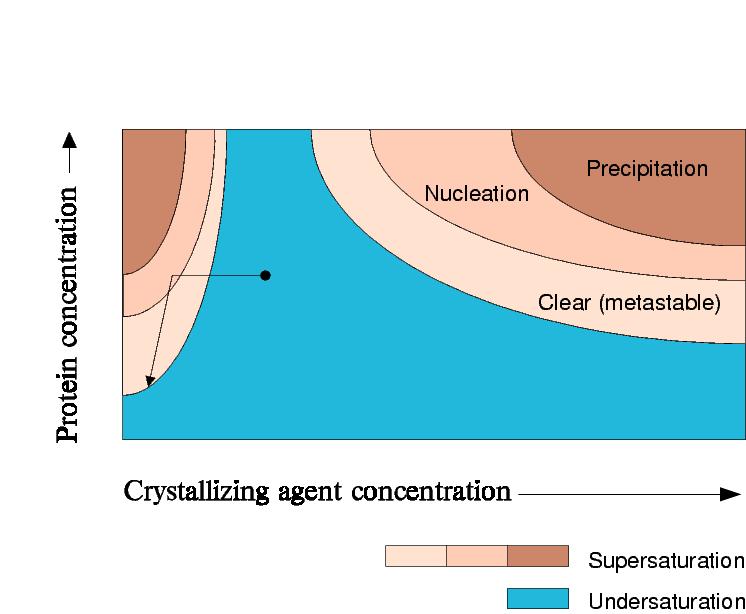
 Phase
Diagram for vapour diffusion experiment, no crystals
Phase
Diagram for vapour diffusion experiment, no crystals
|
|
Vapour Diffusion Experiment
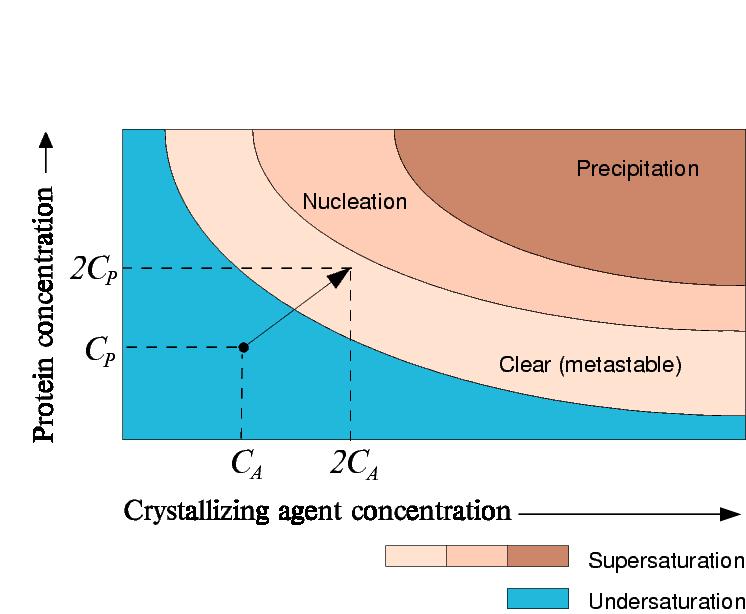
In a vapour diffusion experiment where equal volumes of precipitant and protein are added in the drop, both the precipitant and protein concentration will double.
Phase
Diagram for vapour diffusion experiment, no crystals
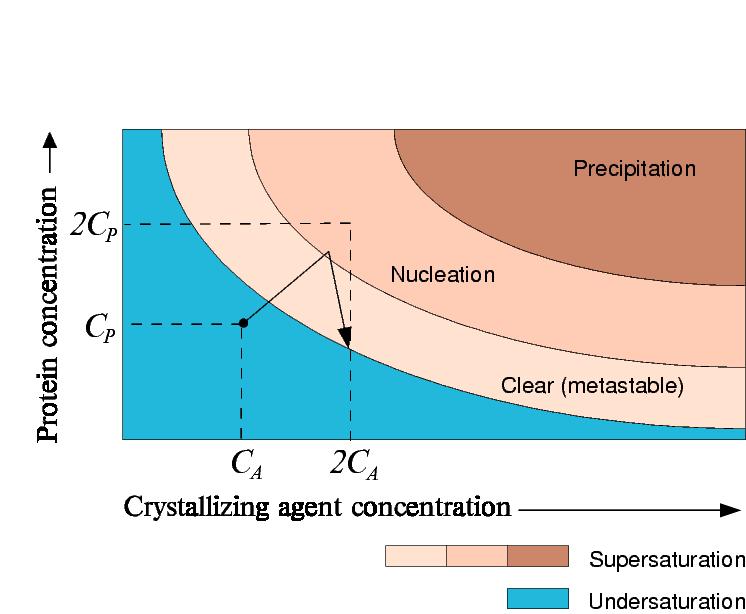
However, if crystals begin to grow, the concentration of protein in solution will decrease.
 Phase
Diagram for vapour diffusion experiment, crystals growing
Phase
Diagram for vapour diffusion experiment, crystals growing
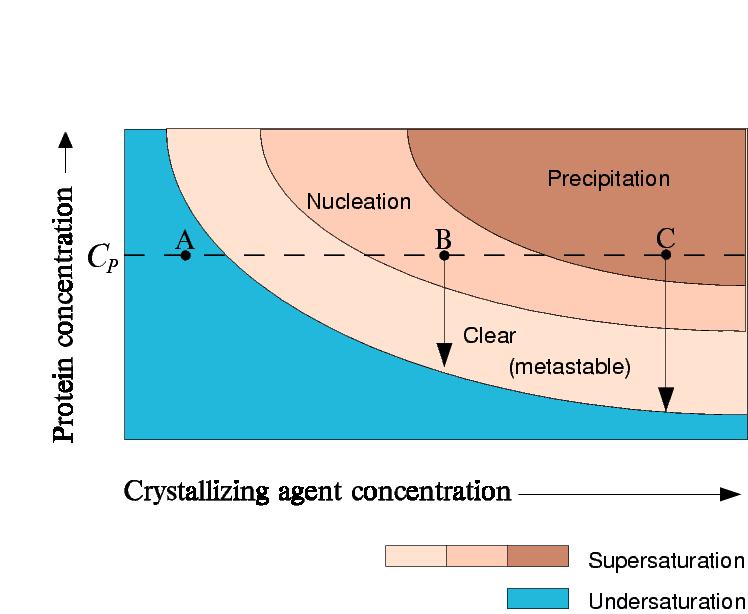
In batch crystallization the precipitant and protein concentration stay
the same.
Point A: Protein stays undersaturated
Point B: Protein crystallizes and the concentration of protein in solution drops
to saturation
Point C: Protein precipitates, but crystals may still grow
 Phase
Diagram for batch experiments
Phase
Diagram for batch experiments
In a dialysis crystallization experiment, the concentration of the protein is constant (if one assumes the stretching of the membrane is negligible and that the initial solution fills the chamber completely).
In a salting-out experiment, the precipitant concentration increases.
 Phase Diagram for a salting-out dialysis experiment
Dialysis has the advantage the the precipitant concentration can be
altered during the course of the experiment.
You can also increase the concentration of one precipitating agent while
decreasing the concentration of another.
 Phase
Diagram for a dialysis experiment, changing buffers
Phase
Diagram for a dialysis experiment, changing buffers
Dialysis can also be used to exploit the salting-in region of the phase diagram by forcing the protein out of solution by lowering the precipitant concentration.
 Phase
Diagram for desalting
Phase
Diagram for desalting
© 1999-2005 Airlie J McCoy, University of Cambridge. All rights reserved.
Last updated: 7 June, 2005